Prijavi problem
Obeleži sve kategorije koje odgovaraju problemu
Još detalja - opišite nam problem
Status problema i sve dodatne informacije možete pratiti klikom na link.
Molimo vas da pokušate kasnije.
Open data analysis
To understand the world we live in and make decisions based on data, we have created a handbook that allows you to analyse and visualize data and draw conclusions based on them.
The Open Data Analysis Handbook is a new publication on the petlja.org portal. Using sets of open data, the author of the Handbook, Aleksandra Alorić, opened questions related to the availability of education, the seasonality of the flu, and public city transport in Belgrade, while she also showed us that we could present a book as a set of data that we can analyse. The aim of the Handbook is to let everyone interested in the topic of data analysis and visualization have the opportunity to get acquainted with the basic concepts, step by step, using the Python programming language and the interactive computing environment Jupyter.
Although the roots of data collection and processing can be found in the distant past, nowadays, when we talk about data analysis, we mostly mean data that are in electronic form and are so numerous that it is impossible for a person to view, process and draw adequate conclusions from them without the help of a computer. Needless to say, modern business processes cannot be imagined without teams of people whose job is to deal exclusively with data, their analysis, and drawing patterns of user behaviour so that the decisions companies make about the future steps are based on data.
Furthermore, it is important to know how to present the data in addition to the data analysis. Most people find it easier to remember information when it is visually presented. Choosing whether to display data through a bar or line graph or a popular “pie” chart is equally important. Thus, someone who may not know enough about the topic in question or simply does not have the time to deal in detail with the entire analysis can get the first impression of the data and conclusions we want to present.
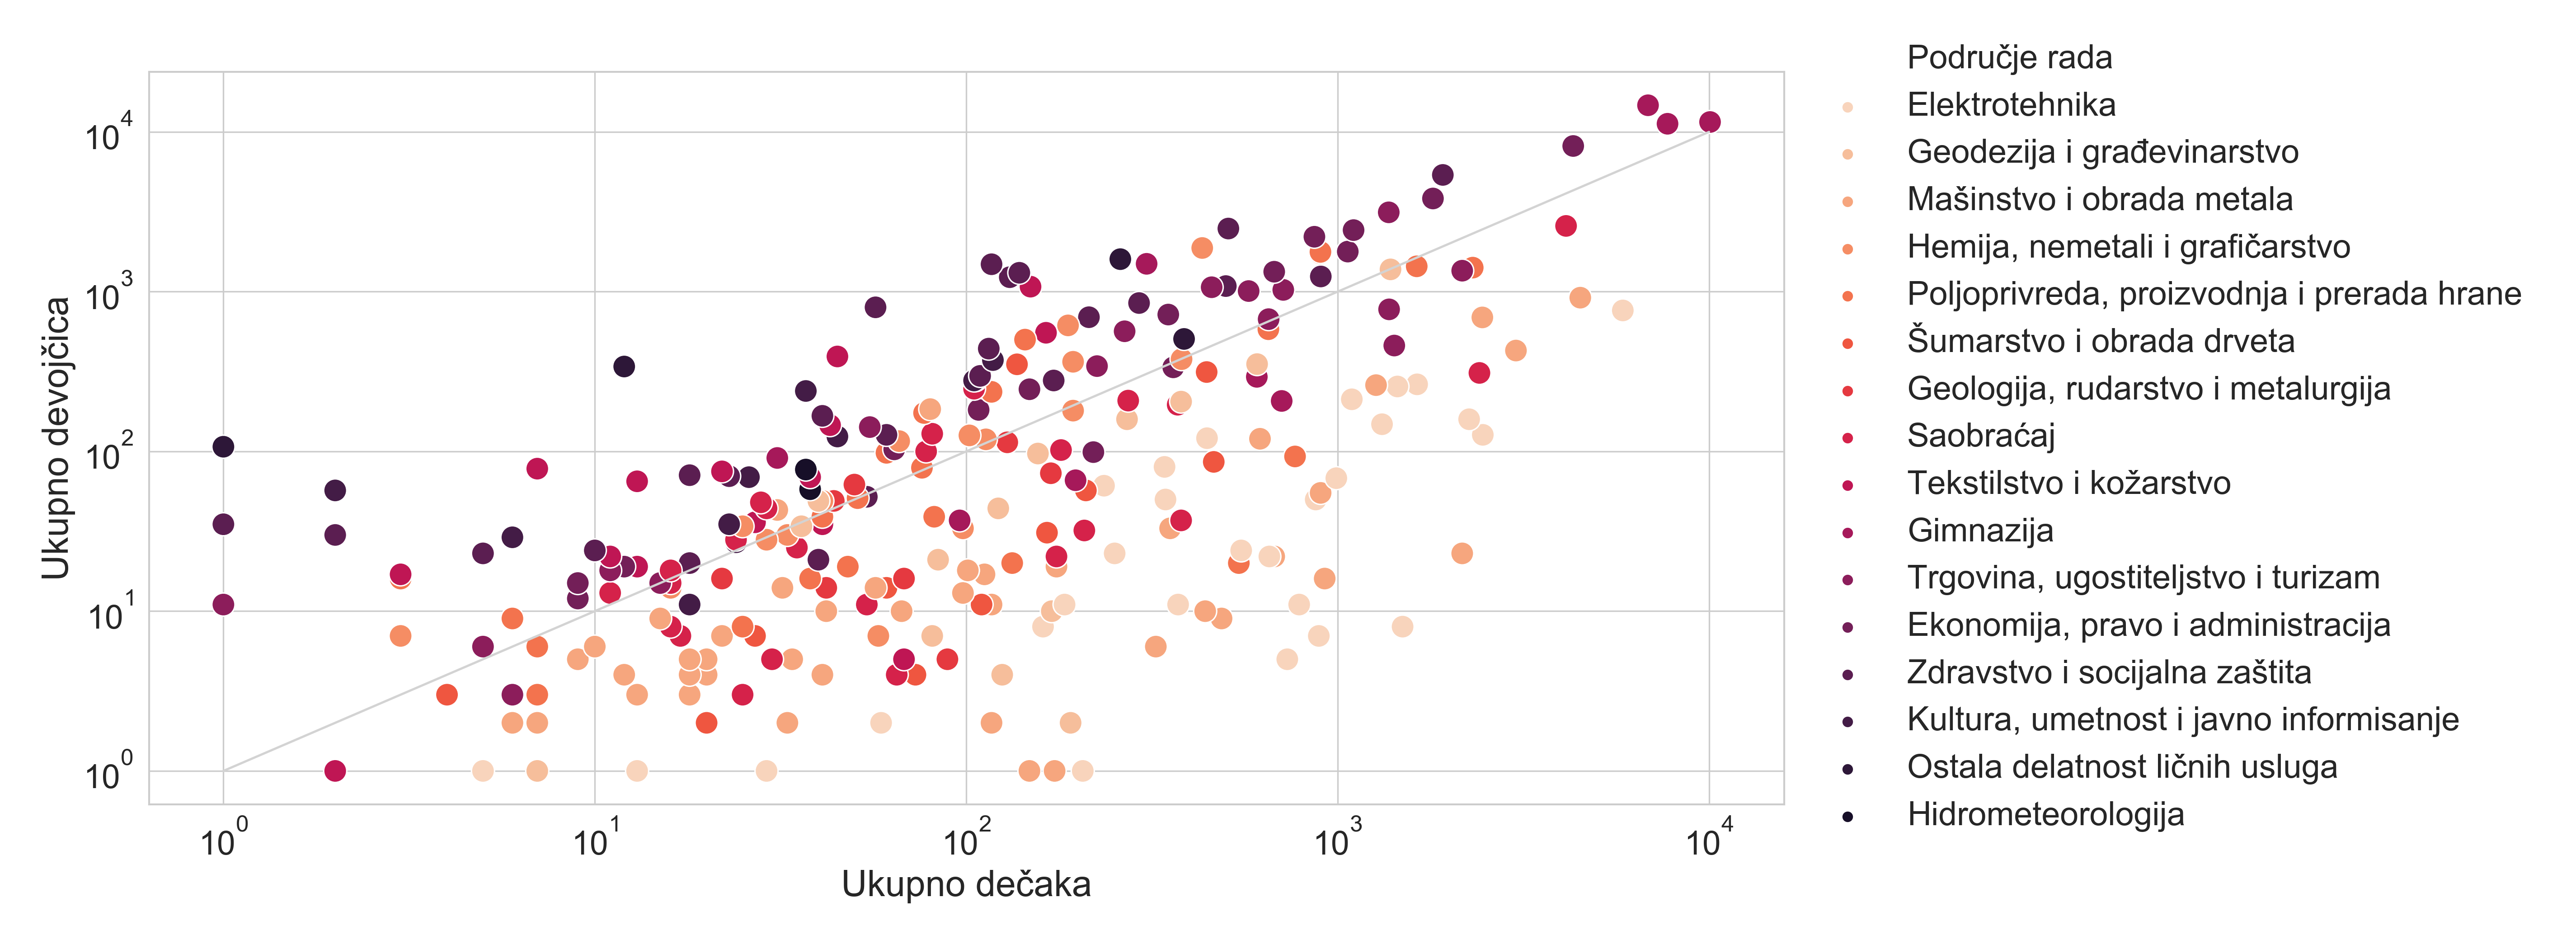
In that light, the Handbook in front of you is intended for anyone who wants to acquire basic knowledge on this topic, regardless of whether he/she is in high school, attending college or is employed. The Handbook consists of examples of the analysis of publicly available data, followed by explanations and visualizations. The examples used in the Handbook have been carefully selected so that they are known and close to us in some way, such as which high school classes are popular or how many schools there are with over 1000 students and their geographical representation, as well as examples referring to places where traffic accidents most often occur. Although we may initially intuitively assume the answers to these questions, our intuition is often wrong or not good enough, so it is far better to confirm our assumptions by analysing the data and only draw conclusions based on the analysis. Therefore, we recommend that you go through this Handbook lesson by lesson, and do not stop at the examples that we offered, research other data and see what new information you can discover.
Public announcement

The Petlja Foundation stands firmly with its collaborators and community—teachers, students, and pupils.
Read moreThe 17th BubbleCup competition is now finished

The final round of the seventeenth annual Bubble Cup competition for university and high school students was held in Belgrade, organized in collaboration with the Microsoft Development Center in Serbia.
Read more