
Working with Blocks from the Led Category
In this part we will get to know the blocks from the category  , as well as how we can define the location of the LED on the screen, so we can turn them on based on their position on the screen.
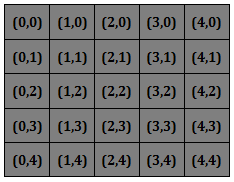
The Cartesian coordinate system is used in mathematics to define the position of points in a plane. In the Cartesian coordinate system, there are two coordinate axes defined: x and y.
The screens of the Micro:bit and the MakeCode simulation use this system to define the position of LEDs on the screen. The x and y axes form a 5 x 5 grid, the grid of rows and columns, where there are 5 LEDs on the horizontal axes, coordinate axis x (row), and 5 LEDs on the vertical axes, coordinate axis y (column). The upper left corner has the coordinates (0,0), while the values of the x coordinate range from 0 to 4, and they increase by 1 from left to right; the values of the y coordinate range from 0 to 4, and they increase by 1 from top to bottom. For example, if the LED is located in the first row and in the third column, its coordinates are (0,2).
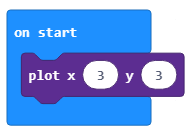
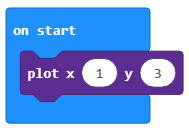
Create a program, which will turn on the LED with the coordinates (3,3).
Drag the block 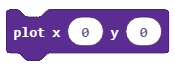 from the category into the block
  , which is already on the work surface.
The final look of the code:
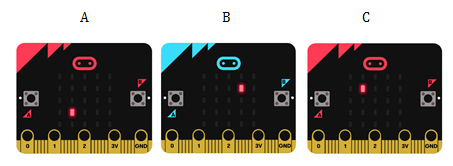
To test the program, we will run it in the simulator by clicking the  button.
- LED on the simulator A.
- The answer is correct!
- LED on the simulator B.
- The answer is not correct!
- LED on the simulator C.
- The answer is not correct!
Q-6: Look carefully at the block.
Which LED will be lit on the screen after the program has started running?
If we want to turn off the LED, we will use the block  , in which we will define the position (coordinates) of the LED we want to turn off. In other words, we define the x and the y coordinates of the LED.
Task. Have all the LEDs turned on at the beginning of the program. When the user presses button A, the LEDs located in the corners of the screen will be turned off.
You can compare your solution with ours: https://makecode.microbit.org/_4e6RXM5FmA8M
Task. Create a program, which will simulate traffic lights by alternately switching on and off the LEDs located in the third row and the second, third and fourth column.
Little help: As the traffic lights turn on and off at certain intervals (let’s say 1 second), you should use the block 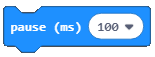 to define that interval.
You can compare your solution with ours: https://makecode.microbit.org/_TRPRj98xj2Ap
The  block is the block used to turn on the LED if it is turned off, or to turn it off if it is on. Of course, in this block, we need to set the values for the x and y coordinates.
- The light will turn off after 1 millisecond.
- The answer is not correct!
- The light will turn on and off every 1 millisecond.
- The answer is correct!
- The light will turn on after 1 millisecond.
- The answer is not correct!
Q-7: Look carefully at the block.
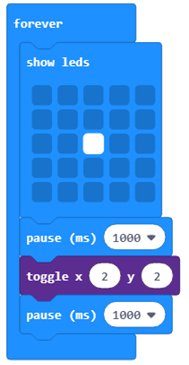
What will be displayed after the running of the blocks presented above?
Addition: To analyze the input data (graphically), in our case, the light level, we can use the block 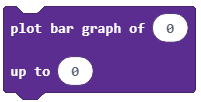 where we will enter the initial and the final value of the interval that should be analyzed.
In our case, the initial value will be the block  (which stores the value of the light sensor reading), and the final value will be 255 because the amount of measured light ranges from 0 to 255.
The block is dragged into the block  from the category
  .
.
The look of the block:
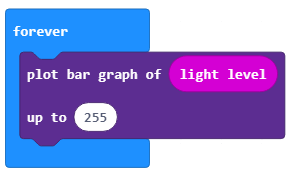
To test the program, we will run it in the simulator by clicking the button.
In this case, we will open the simulator, which displays the data as a graph.
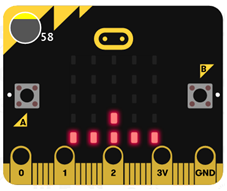
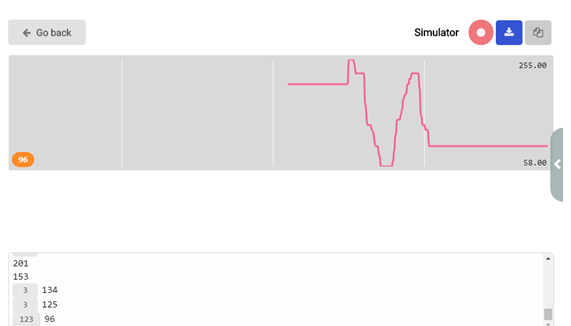
This simulator will run until we stop it by clicking the  button. If we want to download the collected input data, we can download it to our computer in the .csv format, by clicking the
  button. This document contains columns with time (in milliseconds) and measured light level.